
Windsor and Maidenhead homes fell 3.9% in the year to July 2026, the 18th steepest drop of 295 English districts. Only West Berkshire rose in the county.
The average home in Windsor and Maidenhead sold for £575,036 in July 2026, down £23,577 on the year, a fall of 3.9%. That is the eighteenth steepest annual drop of the 295 English local authority districts, and it comes in a month when England as a whole rose 1.1%.
The figures are the HM Land Registry UK House Price Index for July 2026, published on 16 September.
A year on from the borough’s record high
July 2025 was the most expensive month in this borough’s recorded history. The average then was £598,613, the highest in the index since it began in 1995.
A year later the same measure is £23,577 lower. The annual fall and the fall from the all-time peak are the same number, because the peak was exactly twelve months ago.
The borough is still the eighteenth most expensive district in England. It is losing value from a very high base, not becoming cheap.
Every type fell, and flats fell hardest
| Type | July 2026 | Annual change |
|---|---|---|
| Detached | £1,126,843 | −3.6% |
| Semi-detached | £602,082 | −2.7% |
| Terraced | £481,881 | −3.1% |
| Flat | £304,000 | −6.2% |
| First-time buyer | £427,828 | −4.2% |
| Home mover | £715,724 | −3.7% |
| All types | £575,036 | −3.9% |
Flats are the outlier. At £304,000 they are down £20,092 on the year, a fall of 6.2%, which is itself the eighteenth steepest fall in flat prices of the 295 English districts. The detached average is more than three and a half times the flat average, a gap of £822,843.
For a first-time buyer, the average is £427,828, down £18,712 on the year. That is still more than the all-property average in every other Berkshire authority except Wokingham.
Berkshire is not moving together
Five of the six Berkshire unitary authorities fell in the year to July. Only West Berkshire rose, and only by 0.4%.
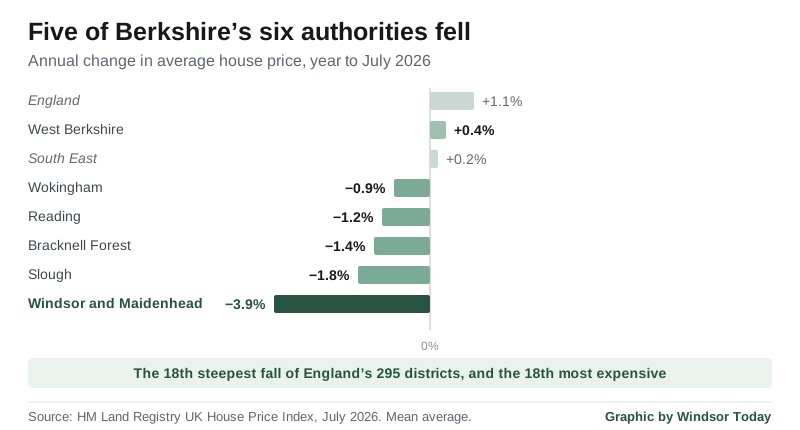
The Royal Borough fell more than twice as far as Slough, the next steepest in the county. A year ago the gap between the two averages was £256,532. It is now £239,277, so Slough has closed £17,255 of it in twelve months.
Fewer sales than at any point since the pandemic
Prices are one half of the picture. The other is how many people are actually moving, and here the numbers are thin.
The Land Registry publishes sales volumes about three months behind prices, so the latest usable month is May 2026, at 95 sales. Across January to May the borough recorded 549 sales.
That is the lowest January to May total since 2020, and outside the 2009 crash and the first lockdown it is the lowest in the thirty-two years the index has run:
- 2009: 452 sales
- 2020: 529 sales
- 2026: 549 sales
- 2023: 669 sales
- 2024: 710 sales
- 2025: 911 sales
The 2025 comparison needs a warning. March 2025 recorded 372 sales against 134 this March, because the stamp duty thresholds changed on 1 April 2025 and buyers rushed to complete. Do not read that month as a collapse in demand.
The June figure has been revised
The index is provisional and gets restated. When we reported the June figure in August, the Land Registry had published it as £576,992, an annual fall of 2.2%. In this release the same month is restated as £580,299, a fall of 1.6%.
That is a revision of £3,307 in the borough’s favour, and it is normal. Treat the newest month in any UKHPI release as the least reliable one.
What it means for you
- UKHPI is a mean average of completed sales, not a median. A handful of very large sales in Bray, Cookham or Ascot pulls it upwards. Our Windsor house prices page carries the median by post town and postcode sector, which is closer to what a normal street looks like.
- If you are selling a flat, your asking price from a year ago is very likely wrong. Flats are down 6.2%, more than double the semi-detached fall.
- If you are buying, the borough has given back a year of gains, but it is still the eighteenth dearest district in England and the dearest in Berkshire by £78,499.
- If you are watching your council tax, banding is fixed at 1991 values and does not move with the market. See Windsor council tax bands.
- The next release covers August 2026 and is published at 9.30am on Wednesday 21 October 2026.
Frequently asked questions
What is the average house price in Windsor and Maidenhead?
£575,036 in July 2026, according to the HM Land Registry UK House Price Index. That is a mean average across all completed sales in the borough, which covers Windsor, Maidenhead, Ascot, Eton, Datchet, Bray and Cookham.
Are Windsor house prices going up or down?
Down. Prices fell 3.9% in the year to July 2026 and 0.9% in the month, while England rose 1.1% over the year. The borough recorded the eighteenth steepest annual fall of 295 English districts.
Which type of home has lost the most value?
Flats. The average flat in the borough was £304,000 in July 2026, down 6.2% on the year. Detached homes fell 3.6%, terraced 3.1% and semi-detached 2.7%.
How much does a first-time buyer pay in Windsor and Maidenhead?
An average of £427,828 in July 2026, down 4.2% on the year. That is still higher than the all-property average in Slough, Reading, Bracknell Forest and West Berkshire.
Is Windsor and Maidenhead still the most expensive part of Berkshire?
Yes, comfortably. At £575,036 it is £78,499 above Wokingham, the next dearest, and £239,277 above Slough, the cheapest of the six Berkshire authorities.
Sources
- HM Land Registry, UK House Price Index, Windsor and Maidenhead, July 2026 release.
- HM Land Registry, UK HPI full file, July 2026, used for the rankings against all 295 English local authority districts, the Berkshire comparison and the monthly sales volumes back to 1995.
- Our own report of the June 2026 figure, for the revision.
Have your say